|
Select the orbital you wish to display using the drop-down menus.
"Click and drag" on the 3D picture of the orbital to rotate it; "Click, shift and drag" to zoom in and out.
The 3D representation can be shifted between solid, translucent and mesh views by using the "Model View" buttons.
You can alter the value of the wavefunction at which the
iso-surface is plotted by typing a new number into the "Iso-surface
value" box and clicking the "Update" button.
Checking the "Nodal Surfaces" box draws the zero valued iso-surface
(as a green mesh) on the plot; this shows the positions of the radial
and angular nodes.
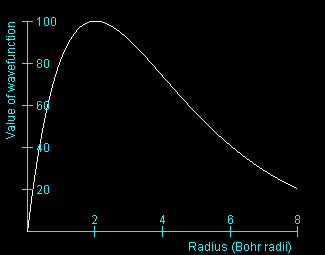
The graph shows the radial part of the wavefunction. The red and
blue lines indicate the values at which the positive and negative
iso-surfaces are being plotted.
|